Today’s advanced analytics space is filled with tools to help users become more data driven. However, every use case is different, and there is not a single tool that is ready for each unique situation. The best solutions for a given organization usually lie in a combinations of software platforms. This blog post outlines why Silectis Magpie and Looker partnered create an end-to-end analytics flow.
COMPLEMENTARY TOOLS TO GET INSIGHT
Generating and sharing insights using innovative tools like Looker has become a top priority for organizations. But teams still struggle to get access to all their organization’s data. Silectis Magpie brings data into one place so that teams can focus on analytics. Magpie gives organizations enterprise-standard infrastructure without the massive investment of time, money, and resources. Combining Looker’s powerful analytics features with Silectis Magpie makes teams more productive by making sure the underlying data is organized, reliable, and secure.
DATA PREPARATION AT SCALE
Most analysts have had their time stolen by cumbersome data preparation. ‘Data preparation’ refers to shaping, combining, or rolling-up data prior to analysis. What happens when pipelines and transformations get complex? How do teams build repeatable, high-performance data pipelines pulling from a myriad of data sources? Organizations have provisioned data engineering tools and resources, separate from analytics workflows, to address these more advanced needs.
This is why Silectis built Magpie. Teams want to spend more time getting value from their data and less time organizing data. Teams using Looker to discover insights can rely on Magpie to automatically prepare data for analysis.
MAGPIE MAKES DATA ENGINEERING EASIER
Magpie makes data engineering seamless with clean, easy commands for common data engineering tasks. With a single line of code, teams create and manage data sources, pull data from the web, profile data, schedule jobs, and setup notifications.
Part of the reason the engineering piece can be so challenging is the landscape of tools and sources of data become more daunting by the day. Teams struggle to connect the technology pieces between cloud infrastructure, big data processing, and automation/schedulers. Under the hood, Magpie unifies these technologies so teams can address their data engineering needs in a single tool, rather than managing the entire technical stack.
REAL LIFE EXAMPLE: MARKET AND FINANCIAL DATA
To demonstrate how one can use Silectis Magpie and Looker to create rich analytics, we created an example analysis that serves complicated financial analysis through Looker’s clean user interface.
Our example Looker Explore contains daily historical values for stocks, bonds, commodities, and other financial vehicles. The Explore uses Magpie to access up-to-date data automatically pulled from hundreds of financial sources. For instance, commodities such as lumber, crude oil, and soybeans are pulled from 36 separate Quandl streams. Transforming data and running calculations on the data is another stage of the pipeline. Calculations on stock splits, for example, take about a dozen steps which build and update separate reference tables. The Explore provides our prospective end-user with a full set of financial metrics:
- Daily Logarithmic Return
- Year-to-Date Growth
- 10 Year Growth
- 50 Day Moving Average
- 200 Day Moving Average
- 1 Month Volatility
- 3 Month Volatility
- 12 Month Volatility
Magpie calculates each of these metrics in bulk. The ability to automate complicated calculations on an ongoing schedule allows us to enrich the raw data streams with deeper intelligence. Magpie is the perfect tool to make our market data reliable, performant, and uncomplicated for Looker users.
GENERATE INSIGHT AT EVERY STAGE
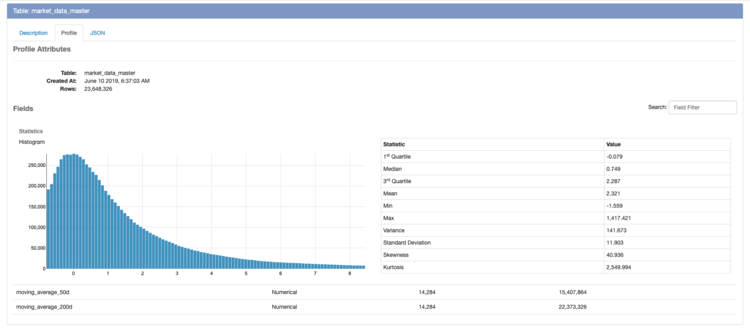
While building a pipeline in Magpie, data profiles can give you a sense of what the data contains prior to analysis. For example, profiling the underlying table shows the distribution of ten year growth. This histogram tells us that asset growth is normally distribution around zero, with the majority seeing small ups or downs while large increases in growth are rarer.

Once our data is in place, we can interrogate the data in the Explore and visualize different financial metrics.
For example, using the calculated Year-to-Date Growth, we can place a handful of the stock values we pulled into one chart and compare those stocks on a common scale. The following Look shows the 2019 growth for 30 top stocks.
There is one stock, Walgreens, that had a pronounced fall that doesn’t coincide with other large drops in growth. In the next Look, we dig deeper into WBA by comparing the value of the stock with the 50 Day and 200 Day Moving Averages that we calculated. Moving averages can provide information on how quickly the value of a stock is changing. The relative positions of the 50 Day and 200 Day Moving Average might have been the canary-in-the-coal-mine for the direction of this stock’s value.
This is a brief example of how unifying data and performing transformations can supercharge insight discovery in Looker.
CONCLUSION
Looker is an excellent way to explore and socialize insights. Magpie provides the data integration, security, and automation tools needed to build an advanced analytics capability. Magpie is a powerful addition to Looker for scaling data preparation when your data gets bigger and is spread across your organization.
Learn how to spend more time getting insight with Magpie; sign up for a demo.
Brendan Freehart is a Data Engineer at Silectis.
You can find him on LinkedIn.
