We’re excited to share that Silectis has released a new suite of automated data lineage features within Magpie, the end-to-end data engineering platform. These features equip users with knowledge of where data originates, when it was published, and who it was published by. This additional context provides users the transparency and accountability necessary to trust their data and react to inevitable data quality issues. Below we’ll cover the basics of data lineage, why it is important, and how Magpie enables teams to trust their data with this important new release.
What is Data Lineage?
Data lineage refers to the entire lifecycle of a dataset from its sources of origin all the way to its current state. Within a data lake, data lineage becomes increasingly complex as the amount of data and number pipelines increases. With each operation in the ETL process there is the potential that data quality issues may be introduced, so it is important for data lineage to be complete. To visualize data lineage, most tools leverage a DAG (directed acyclic graph) interface in which each node represents a dataset, and each edge represents a producer/consumer relationship.
Data lineage provides a number of benefits, which primarily revolve around transparency. Transparency allows data professionals to understand the surrounding context of their data more quickly and provides the ability to more easily evaluate the validity of their data. Additionally, transparency in data lineage creates accountability. By understanding the producer/consumer relationship of all the data within a data lake, data quality issues that arise can quickly be identified and traced back to their source.
Let’s consider a common scenario: a given dataset is consumed by several downstream pipelines and a data quality issue is discovered. With access to data lineage tooling, a data producer is empowered to quickly identify each of the impacted downstream pipelines and notify the owners of the error. The impact can then quickly be evaluated and acted upon by each consumer. However, teams without the ability to track data lineage may not identify all of the impacted consumers, resulting in persistent data quality issues that get propagated throughout their data lake. As this process repeats itself, data lakes devolve into dreaded data swamps. With proper data lineage tooling, teams can prepare themselves to react effectively and efficiently to these situations.
How Does Magpie Enable Data Lineage?
So, how does data lineage come to life in Magpie? Backed by a robust metadata repository, Magpie leverages activity tracking and data governance to offer a comprehensive suite of automated data lineage features. With an abundance of tooling items, Magpie’s features include metadata object lineage, read and write event tracking, and table lineage graphs, among others.
METADATA OBJECT LINEAGE
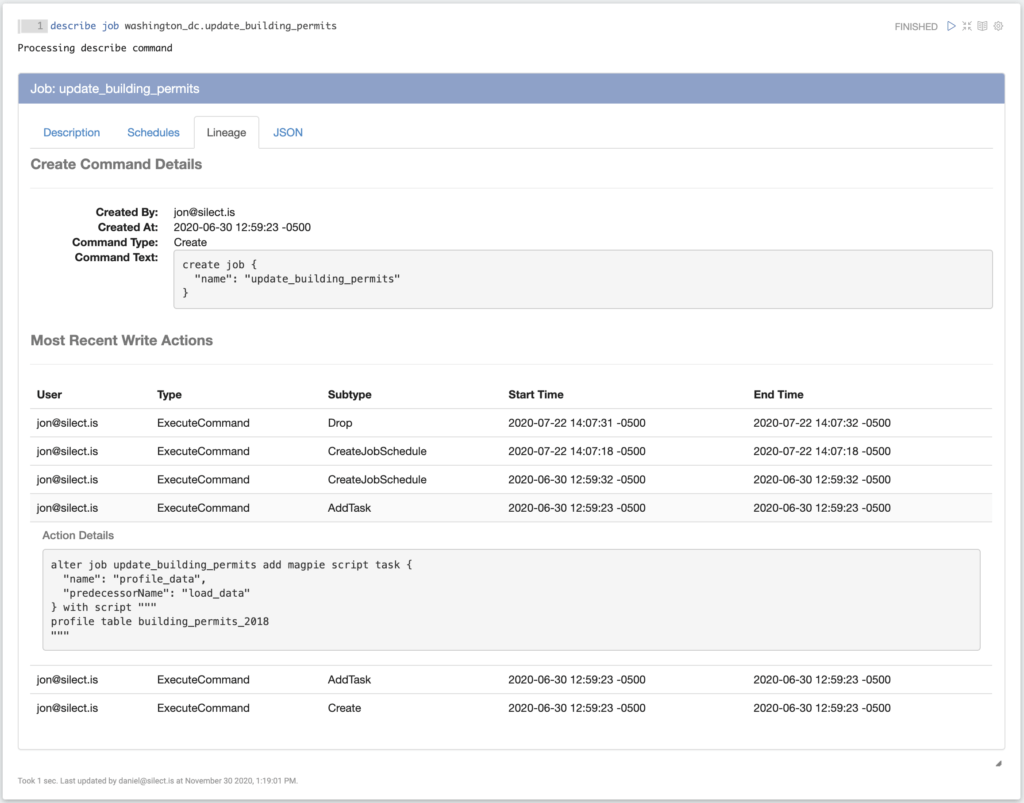
Metadata objects in the Magpie platform include things like data sources, schemas, tables, and jobs. After defining these objects, Magpie tracks all of the actions and usage events related to the objects in a metadata repository. Using this detailed activity history, we can determine how metadata objects are created, when they are created, and who created them. It also enables us to determine how these objects are altered. Harnessing this capability, we’ve implemented metadata object lineage. Metadata object lineage provides transparency to the life cycle of all the objects a user has access to. The image below shows an example of how Magpie’s metadata object lineage can be used to see how a job was created and how it has been modified.

TABLE LINEAGE
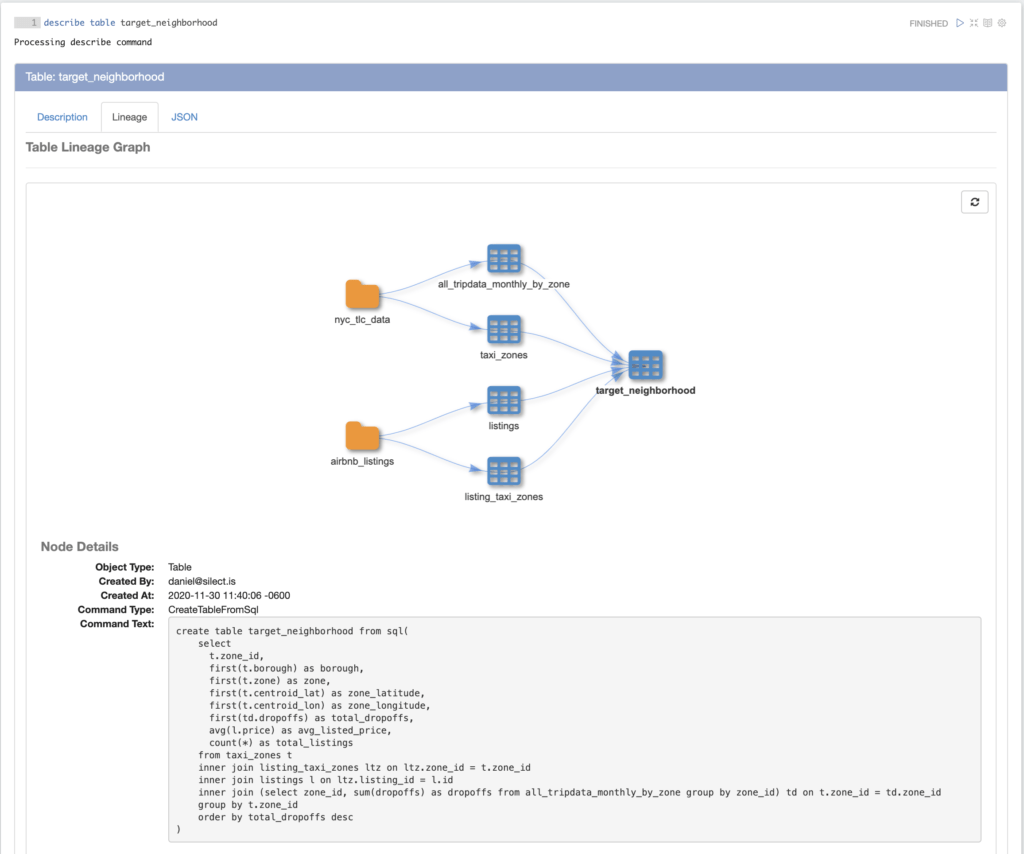
In addition to metadata object lineage, we’ve added table lineage features which are highlighted by table lineage graphs. Magpie table lineage graphs trace data back to its sources of origin allowing users to quickly visualize where a table sits in the greater context of the data lake. Each node in the table lineage graph represents an upstream table or data source. By leveraging the metadata object lineage feature described above, we offer users additional details about each node in the graph through an interactive display.
The image below shows an example of a table named target_neighborhood which was created by joining tables from multiple real estate data sources. Users can instantly gather information about the table’s dependencies and, by clicking on any node in the graph, can quickly discover details about when and how an object was created.

Magpie’s table lineage graphs are coupled with read and write event tracking. These features provide data consumers confidence in understanding where their data is sourced and data producers understanding of how their data is being used.
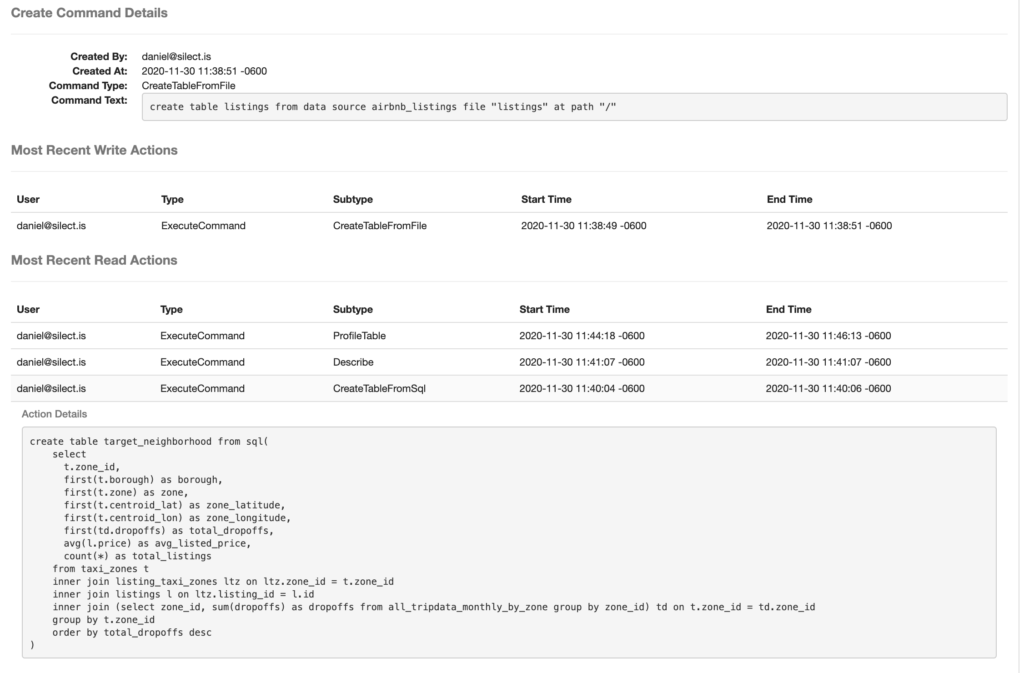
Continuing with the example above, you can see the historical read and write actions in the description of the upstream listings table here. By clicking on any record in the read or write action lists, users are able to see action details. Notice, the read action selected below stems from the action that was used to create the target_neighbordhood table which is described above.

Conclusion
Understanding the intricacies of a large scale analytics environment can be extremely challenging for any data professional. Magpie’s data lineage and profiling features help users get there faster by providing the transparency and context they need to start gaining insights. If you are a data engineer or oversee a team of data engineers and would like to begin harnessing the power of a robust, end-to-end data engineering platform with built-in capabilities such as data lineage and data profiling, join us for a live demo on February 24th.


