As the first step in the data engineering process, data exploration is crucial. Our data engineering platform, Magpie, makes it simple, fast, and ensures accuracy.
GETTING TO KNOW YOUR DATASET
Whether as a new employee, a consultant or contractor, or as someone tasked with working on a new project, most data professionals have experienced the difficult task of understanding a new data set. And, while most of us want to dive right into the analysis, we can’t do that until we understand some key things about that data set.
Is this column really used by the application? When was this table last updated? What is the primary key here? Which of these tables are important? Questions about a new data set are abundant and this task of data exploration can quickly eat up hours and days of a project. If we’re lucky, we have access to someone who has been working with the data already that can answer those questions quickly and efficiently. However, often times that person is not available, or, they can’t spend the time to get each and every person that needs to use the data up to speed on it.
So, we do it ourselves. Is that field a primary key? Compare the row count of the table to the distinct count of that field. Want to know when the table was last updated? Find the right timestamp column and see what the maximum value is. Is that interesting field really used? Write a query to get the count of null values vs non-null values vs number of distinct values. Repeat that and more for every table in your project.
AUTOMATION CAN HELP
This sort of an approach is possible, but it still presents some problems.
First, you only get answers to the questions you ask. What if you find a field that looks like it carries the information you want, and start off your analysis, only to realize later that another field or set of fields has much better coverage of the data set or gives you much more detailed data.
Second, for a large number of tables, this one-off query approach really starts to become a time sink. This might cause you to speed into the analysis phase before really understanding the data, or it might delay the project. Third, when someone else wants to help out with the project, all that knowledge you gained from your exploration queries is lost, and it is only available to your new teammate if you thoroughly documented it or you take time to answer every question he or she has.
Magpie allows for automation through a shared metadata repository and a series of data profiling commands.
As an example, we’ll walk through some anonymized data that a recent Magpie customer has allowed us to share. The customer is an online auction website, and they wanted to use Magpie as their enterprise data lake so that they could perform tasks like better understanding user bid behavior or improving categorization of their items via text analysis.
The data spanned two database schemas containing about 500 total tables and would later be integrated with additional external data sets. Since the application had evolved over many years with many developers, a number of these tables were no longer in use, and there was a fair amount of data that was duplicated across the schemas. The first priority was understanding which of these tables were current and which tables would be most useful to transform and load into a central schema for use in their planned analyses.
UNDERSTANDING SCHEMA CONTENTS
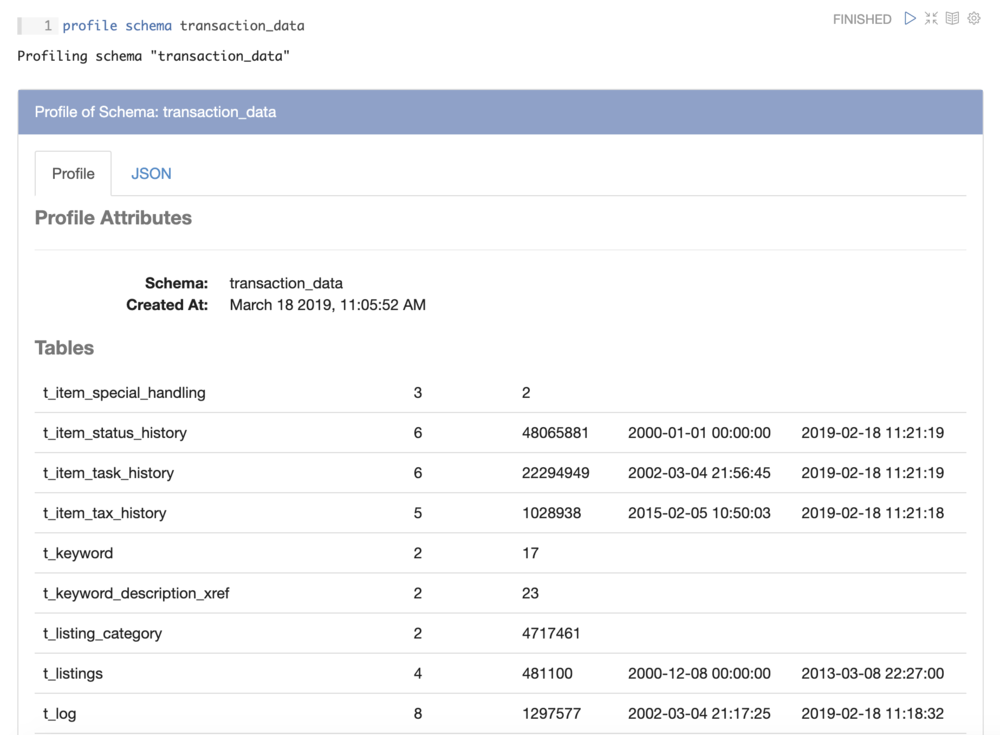
Magpie’s profile schema command performs exactly that function, showing us, for each table, how many fields it has, how many rows it has, and what the earliest and latest timestamp values in that table are:
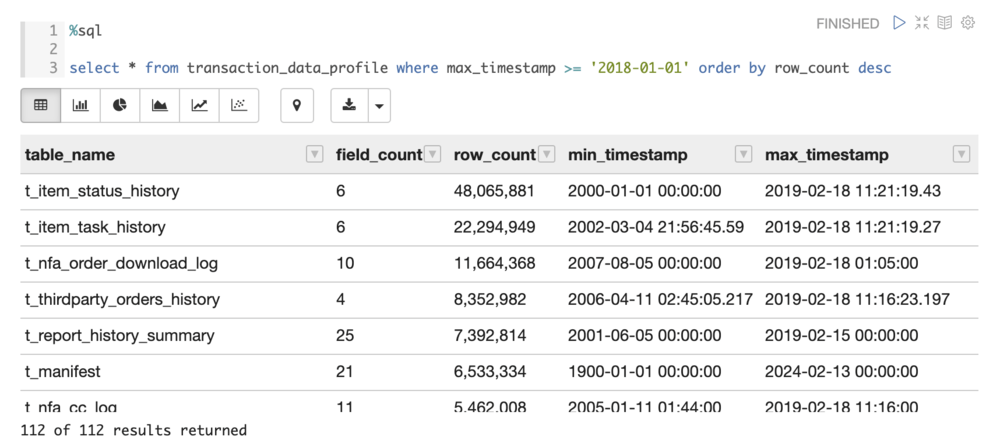
In addition, Magpie makes this profile available to us as a data frame, allowing us to query it directly, or save it as a table for reference by users in the future. Doing this, we were able to write a query that showed us recently updated tables, ordered by number of rows:
UNDERSTANDING TABLE CONTENTS
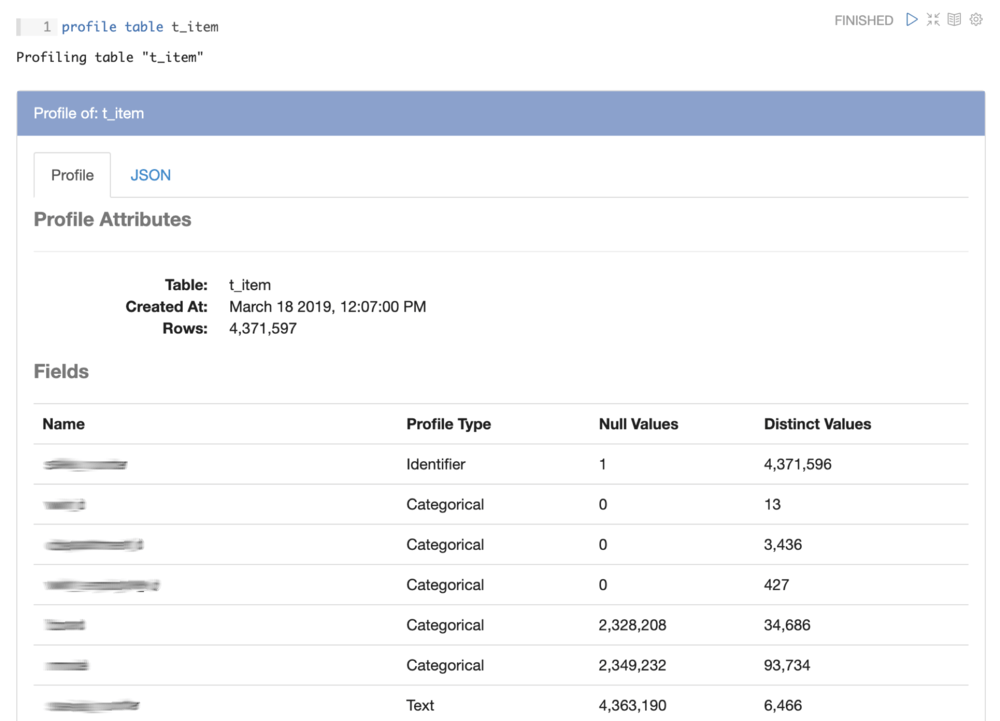
Once we identified the tables that looked most relevant, we were able to profile each of those tables to identify primary keys, understand which fields were used, browse distributions of timestamps fields, and look at how data is distributed across categorical fields, all with Magpie’s simple profile table command. Here is an example profile of one of the auction item tables, with field names redacted:
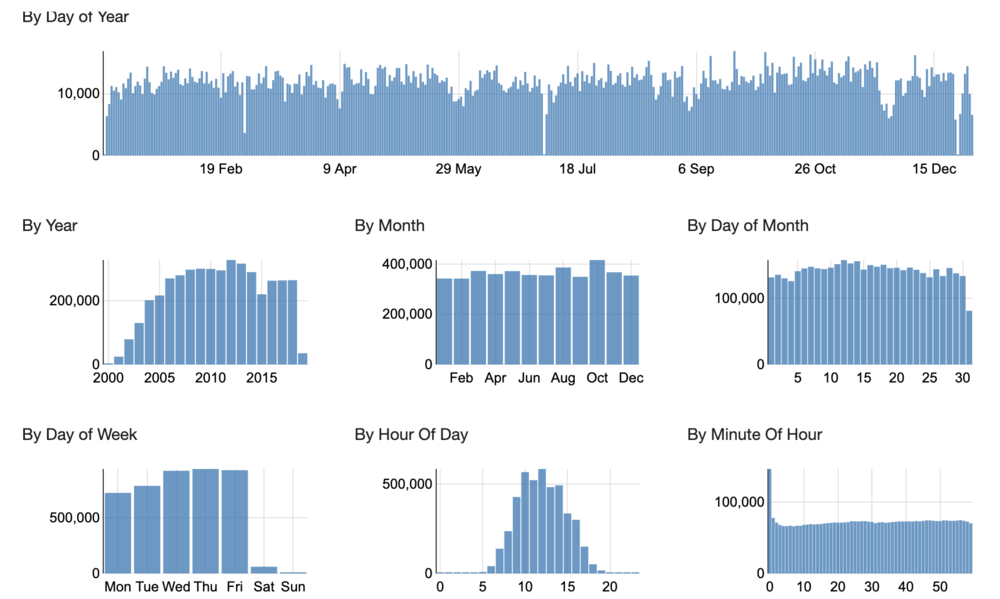
Inside the table profile, the user can click on each field to drill down to additional profile information, generated based on the type of field that it is. For example, here is a profile of one of the timestamp fields in the table:
We were able to perform similar profiles on all of the tables of interest and quickly identify which tables should be loaded into the unified data lake, which fields would be most useful for the customer’s initial analysis plans, and which fields might need some cleanup before being used.
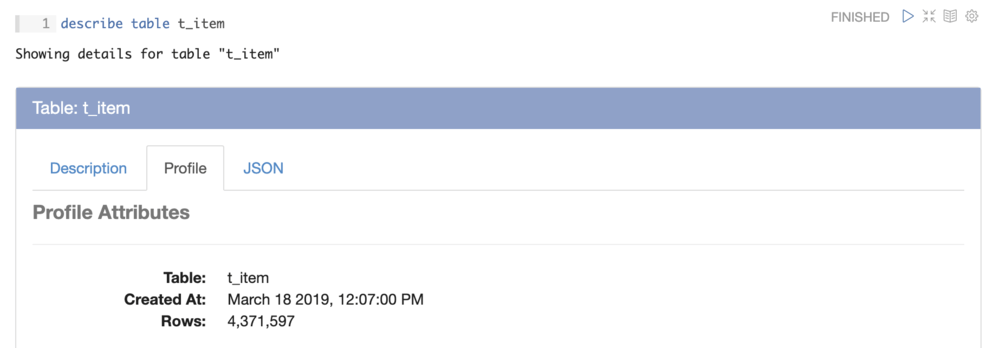
Having these profiling features automated by Magpie is useful, but we really started to see benefit as more people joined the project. When a Magpie user runs a describe command against a table or schema, its most recent profile is returned for reference:
AUTOMATING ROUTINE DATA EXPLORATION LETS YOU FOCUS ON GENERATING USEFUL INSIGHT
By saving and sharing this metadata automatically, Magpie allows a team to collaborate efficiently, reducing duplicated data exploration effort, and enabling data scientists and analysts to focus on performing analyses and getting results.
To learn more about how Magpie can supercharge your data exploration, request a demo.
Jon Lounsbury is the Director of Engineering at Silectis.
You can find him on Github.
